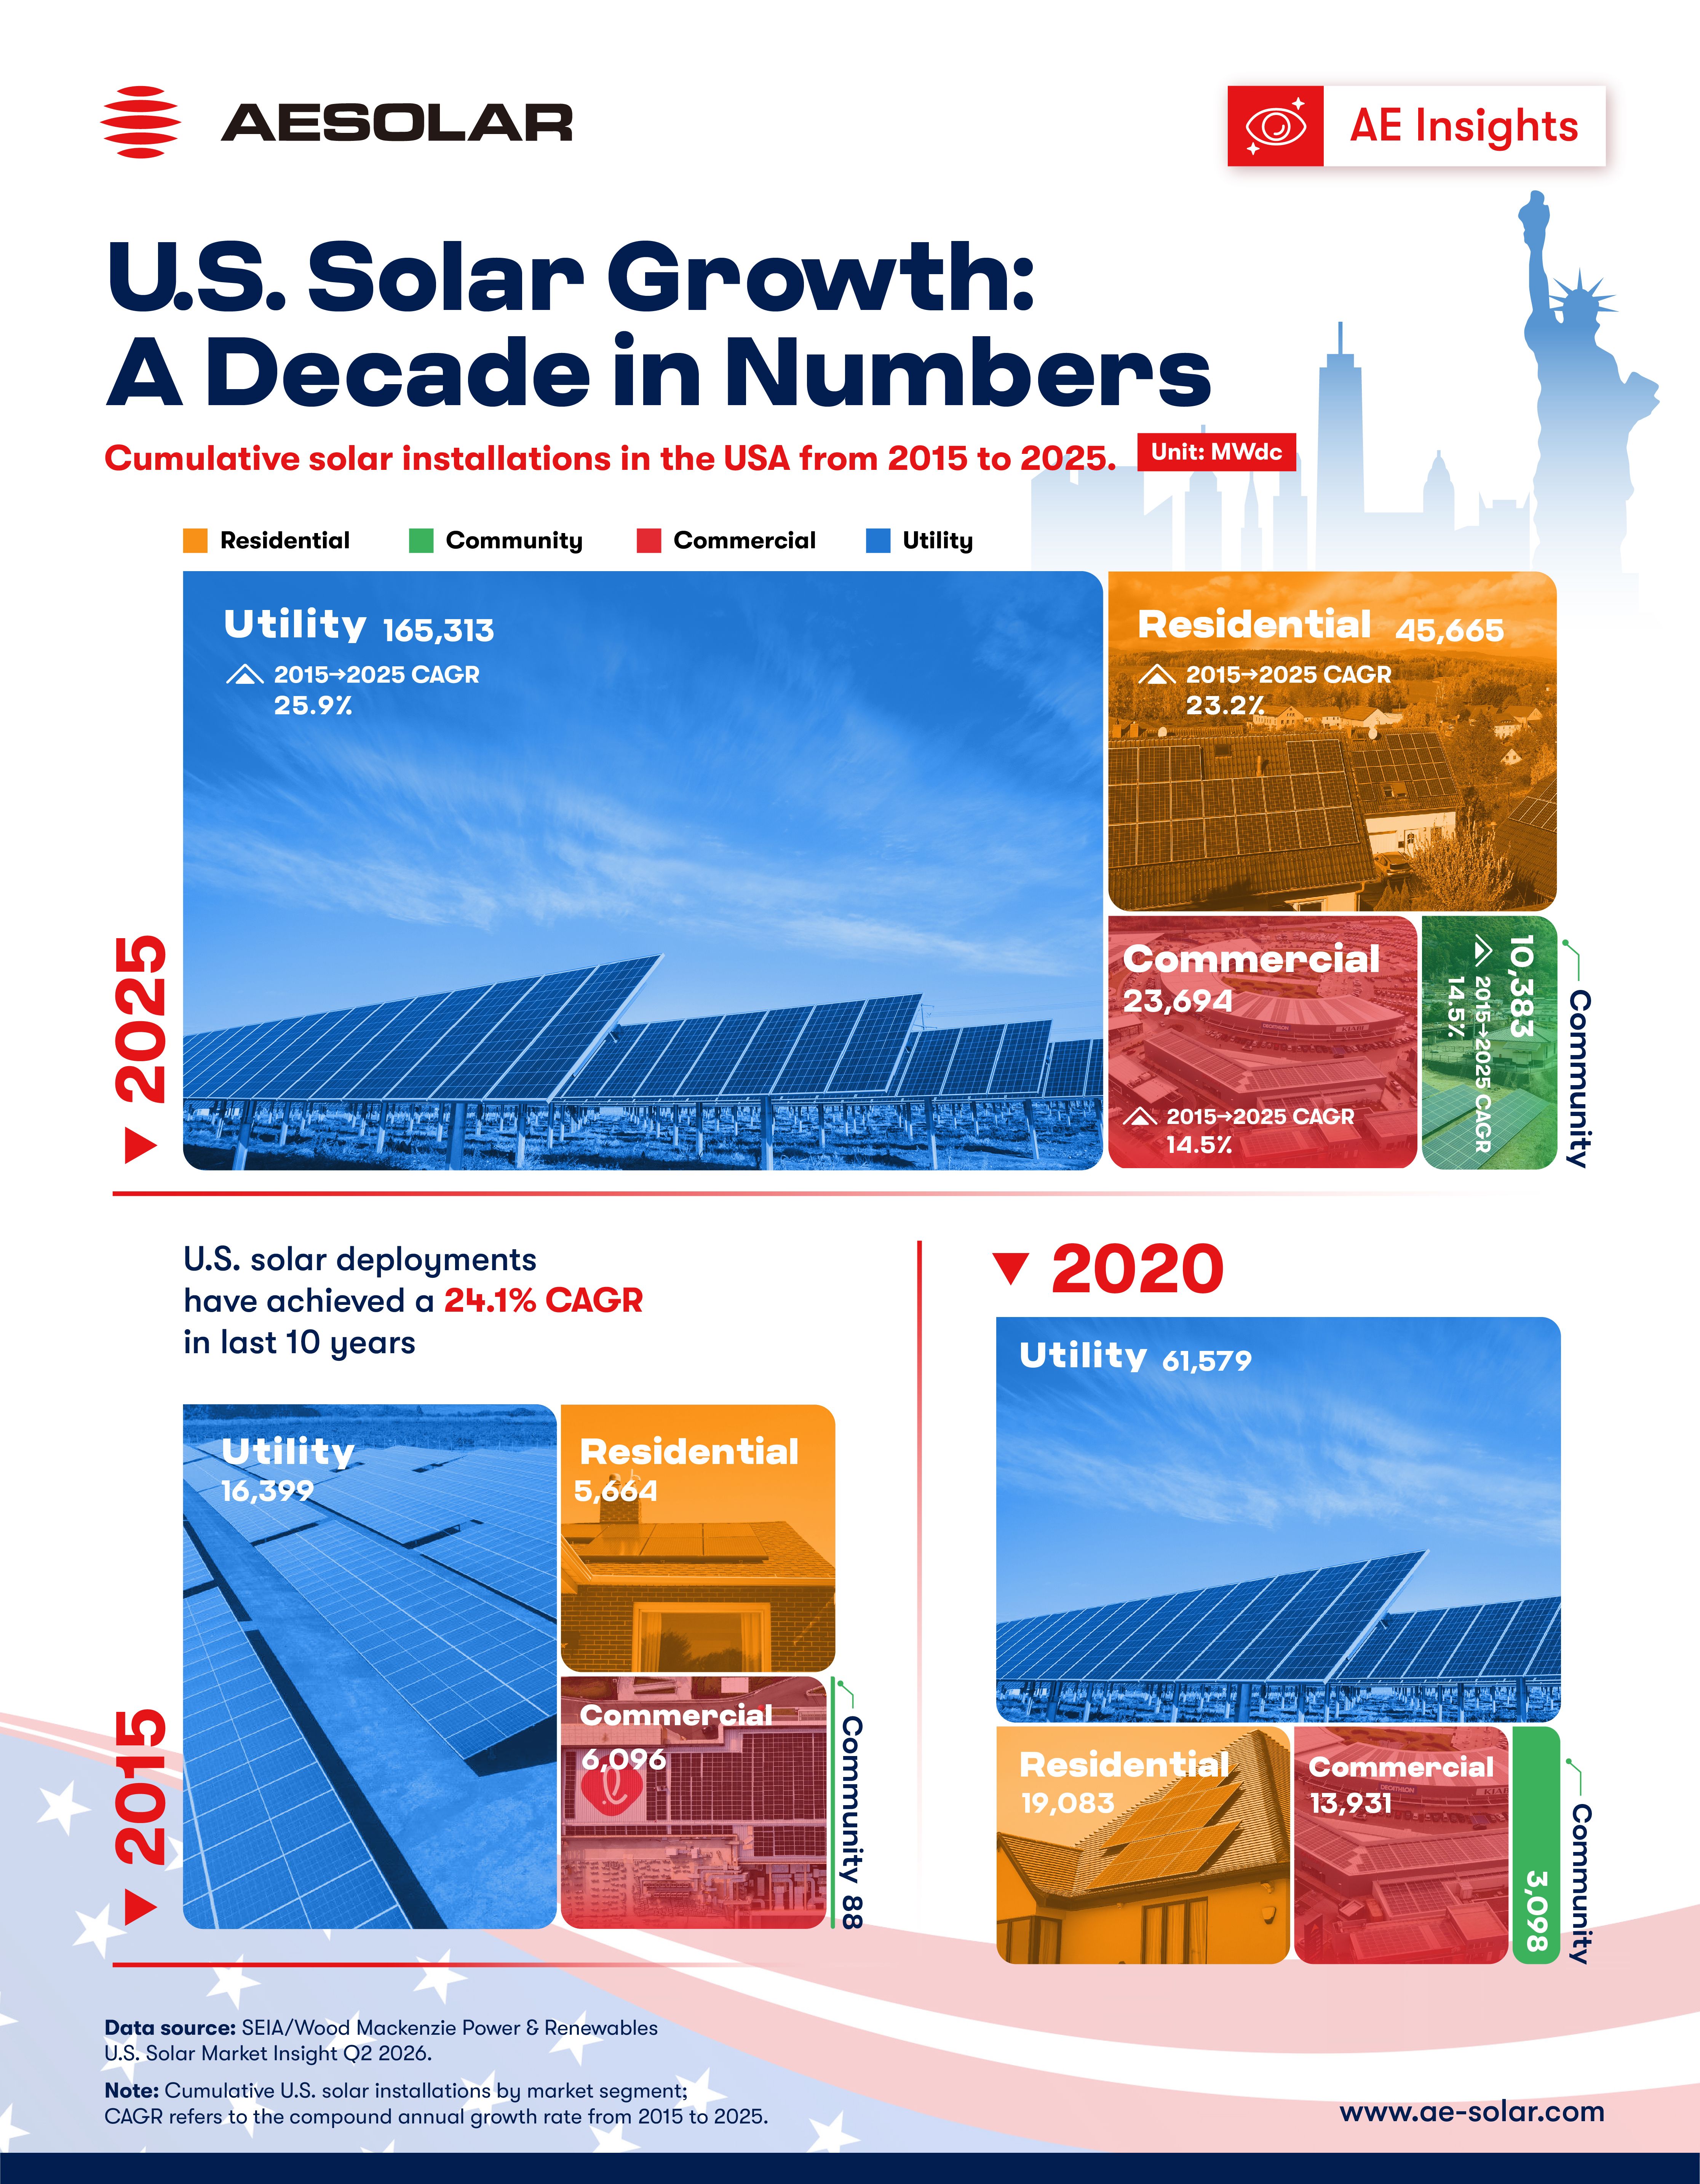
Over the past decade, solar has moved from the edge of the U.S. power system toward its centre. Cumulative installations across the residential, community, commercial and utility segments rose from 28,247 MWdc in 2015 to 245,055 MWdc in 2025, an increase of almost ninefold and a compound annual growth rate of 24.1%, according to the SEIA.
The segment-level figures tell more. Large projects delivered scale, rooftops broadened participation, commercial installations turned unused space into generating assets and community solar opened a route to clean power for customers unable to install panels of their own.
Utility-scale solar built the foundation
Utility-scale solar recorded the largest absolute expansion. Cumulative capacity increased from 16,399 MWdc in 2015 to 61,579 MWdc in 2020, before reaching 165,313 MWdc in 2025. That represents a ten-year CAGR of 25.9%.
By 2025, utility projects accounted for roughly two-thirds of the infographic’s capacity and about 70% of its additions between 2020 and 2025. This scale matters as U.S. electricity demand rises with manufacturing, electrification and fast-growing data-centre loads. The United States installed 43.2 GWdc of solar in 2025, 14% less than in 2024, yet solar still represented 54% of all new electricity-generating capacity added during the year.
Distributed solar created more ways to participate
Residential solar grew from 5,664 MWdc in 2015 to 19,083 MWdc in 2020 and 45,665 MWdc in 2025, achieving a ten-year CAGR of 23.2%. Behind that curve are households seeking less exposure to electricity-price increases, greater resilience and more control over their energy.
Commercial solar expanded at a steadier pace. Cumulative installations rose from 6,096 MWdc to 23,694 MWdc over the decade, equal to a 14.5% CAGR. For businesses, schools, public buildings and non-profits, on-site solar can convert roofs, car parks and other underused surfaces into long-term generating assets.
Community solar delivered the fastest percentage growth. Capacity climbed from 88 MWdc in 2015 to 3,098 MWdc in 2020 and 10,383 MWdc in 2025, producing a 61.0% CAGR. Its small starting point partly explains the rate, but the expansion signals wider access. Shared projects let renters and customers with unsuitable roofs subscribe to solar generation. The U.S. Department of Energy identifies savings, resilience and community-led economic development among its potential benefits.
Policy helped turn momentum into scale.
The decade began with an important signal of policy continuity. In 2015, the Consolidated Appropriations Act extended the 30% federal Investment Tax Credit for eligible solar projects through 2019 and introduced a scheduled step-down rather than an abrupt expiry. That longer runway gave households, developers and investors greater confidence to plan projects and build supply chains.
The Inflation Reduction Act later renewed federal support for clean electricity, storage and domestic manufacturing. At the state level, renewable portfolio standards, clean-energy standards, net-metering structures and local incentives created additional market pathways. As of December 2025, 28 states and the District of Columbia had renewable portfolio standards, while 23 states and the District had a requirement or goal for 100% renewable or clean electricity by 2050 or earlier.
Policy is now entering a more complex phase. For qualifying commercial, community and utility projects, current federal rules place greater importance on construction and commissioning timelines: projects generally need to begin construction by July 4, 2026, or be placed in service by December 31, 2027, to retain full Section 45Y or 48E credit eligibility. New foreign-entity restrictions also add sourcing and compliance considerations.
These changes may reshape where and how projects are financed, but they do not remove the underlying need for new generation.
The next decade will be driven by electricity demand
The near-term market will not be a straight line, permitting, interconnection queues, trade measures and tax-credit qualification remain important risks across the industry. The longer view is more positive. Under the broader national accounting used in its current outlook, SEIA and Wood Mackenzie project U.S. solar to reach 769 GWdc by 2036, adding approximately 490 GWdc from 2026. Utility-scale solar is expected to contribute 381 GWdc and residential solar more than 60 GWdc.
The next phase will require faster grid connections, dependable project execution, more flexible demand, energy storage and solar products suited to different climates, sites and applications. If those pieces advance together, solar can remain one of the fastest and most scalable ways to meet rising U.S. electricity needs.
AESOLAR has established a U.S. office to support North American distributors and customers directly. As the market enters its next stage, explore our solar module portfolio for utility-scale, commercial and residential applications: Discover AESOLAR products.